


REPORT #2: ACCESS, SCALE & MARKET SHARE
Introduction
Remuseum’s initial research report, “Museum Missions & Transparency” (published in the spring of 2024), demonstrated a shift in U.S. art museum missions and highlighted the lack of publicly available data about the field.
Given that nearly all U.S. art museums center the public in their mission statements but share limited data about their public impact, Remuseum followed up on that report by building the first nonproprietary database on operations and impact among over 150 major American art museums, one that uses data to illustrate ways in which museums can maximize their effectiveness in serving the public. Focused on 6 key data points, this database was developed using publicly available data, information provided by museums, and a rigorous academic research methodology.
In this report, the Remuseum database serves to present two key metrics: how effectively museums use their resources to generate visits (measured as cost per visitor) and what percentage of the museum’s regional population visits it in a given year (measured as a percentage of the Metropolitan Statistical Area (MSA) in which the museum is located). This is the first public report of its kind, and as such represents an ongoing research project that will become increasingly detailed, along with the database itself.
But the report’s data are already sufficient to challenge conventional wisdom in several areas, and to support several new conversations about museums while encouraging museum boards and leaders to consider alternate ways to evaluate both their own goals and how effectively their budgets support them. Those conversations could engage any of the three following questions (which we present in more detail below):
- Is it possible that offering free admission might offer a greater path to sustainability and impact than charging for admission?
- Many museums have focused goals on building bigger buildings, bigger collections, and bigger budgets. Is it possible that bigger is not the most effective way to serve a public mission?
- Many museums that focus on serving the community that surrounds them may want to consider how their resources could be deployed to increase their “market share” (the percentage of their regional population that visits each year) as a measure of relevance and impact. Is it possible to “right-size” a museum based on the community it serves?
The purpose of this report is not to suggest that museums should measure themselves in only one way. Its purpose is to support each museum in serving the public as effectively as possible. In that work, there are two foundational principles: making accurate data available to the public, and focusing that data on the way that museums serve and engage the public.
Effective non-profit institutions benefit when more people understand how (and how well) they serve the public. Understanding the “average” museum should not encourage each museum to be average, but to find the best ways to express its own mission in its own way (in its own community, with its own building and its own collection), and to gain more support because it does that work so well.
A foundational measure of public impact is a museum’s number of visitors. Even if a museum chooses to focus on something other than the raw number of visitors – on the diversity of its visitors, for example, or on the quality of each visit – it must begin by measuring visitors. A repeat visitor is a visitor first, and you cannot measure your success at drawing any one type of visitor without knowing who all your visitors are.
A focus on cost per visitor should not imply a goal of reducing those costs but, instead, a fact-based framework to maximize both the quantity and quality of museum visits. The visitor (and a human encounter with art) is the museum’s purpose, and a museum budget represents any one institution’s best guess about how to use its resources to give that purpose life.
The business model of museums – philanthropic institutions essential to the cultural life of our nation – has always been a challenge, and it is especially
challenged today. Museums on average attract fewer visitors than they did five years ago and their costs have materially increased. The purpose of this report, and Remuseum’s work, is to support museums with data that might inspire new ideas and approaches to serving their public mission effectively and sustainably.
– Stephen Reily
Founding Director
About
This
Report
The goal of this report is to provide a clearer picture of how well museums are performing relative to each other, helping museums of all sizes identify opportunities for improvement. The analysis also sheds light on broader trends in the museum field, offering benchmarks and insights that museums can use to enhance their operations, engage more visitors, and ultimately better fulfill their missions.
This initial analysis is the first phase of a longer project that centers transparency and accountability to the public by nonprofit U.S. art museums. By continuing to refine and update the efforts described below, Remuseum aims to establish an ongoing resource for the entire museum field, enabling institutions to learn from each other, to make informed, data-driven decisions, and to maximize their public-serving missions.
Methodology
The research began by selecting which art museums to include. In its first research report, Remuseum used the 199 publicly identified members of the Association of Art Museum Directors (AAMD) as a preliminary sample group. Generating a full database on that group required removing university-based museums, which do not file publicly available information on IRS Form 990. An analysis of data from the remaining 153 American art museums led to grouping them based on whether the museums are free or charge admission, the size of the MSA in which they are located, and their annual budget.
The data collection process followed three main goals:
- Gather the best quality data available;
- Ensure the data are consistent across museums;
- Collect data for as many museums as possible.
This process is outlined in a “logic model” shown in Figure 1, which details the steps followed.
The process of collecting data on museums started by looking at each museum’s mission statement, which was found in their tax documents. These mission statements were grouped based on whether they focused on serving the public, taking care of their collections, or both. This sorting was first done manually, and then checked using an AI tool to ensure accuracy. Next, the team searched the internet for basic information that is widely available for many art museums. The goal was to find key facts about museum operations. This information came from reliable sources such as tax filings, museum websites, and annual reports. Since some data was still missing after the online search, the Remuseum research team sent emails to all AAMD art museums asking for their most recent visitor numbers and financial reports. The request was kept simple to make it easy for museums to respond and provide useful information. In cases where direct data were unavailable, the team gathered “proxy” data from other sources, like social media data about visitor experiences. Finally, a request was also sent through the Remuseum-issued report on the data collected as of Spring 2024, which requested museums provide their data through a portal.
Where there were still gaps in the data, the missing information was carefully filled by estimating, or ‘imputing,’ the numbers based on available data. The aim was to make these estimates as accurate as possible by following a structured process. First, attention was given to data points that had fewer missing entries and were less related to other data points. This included the
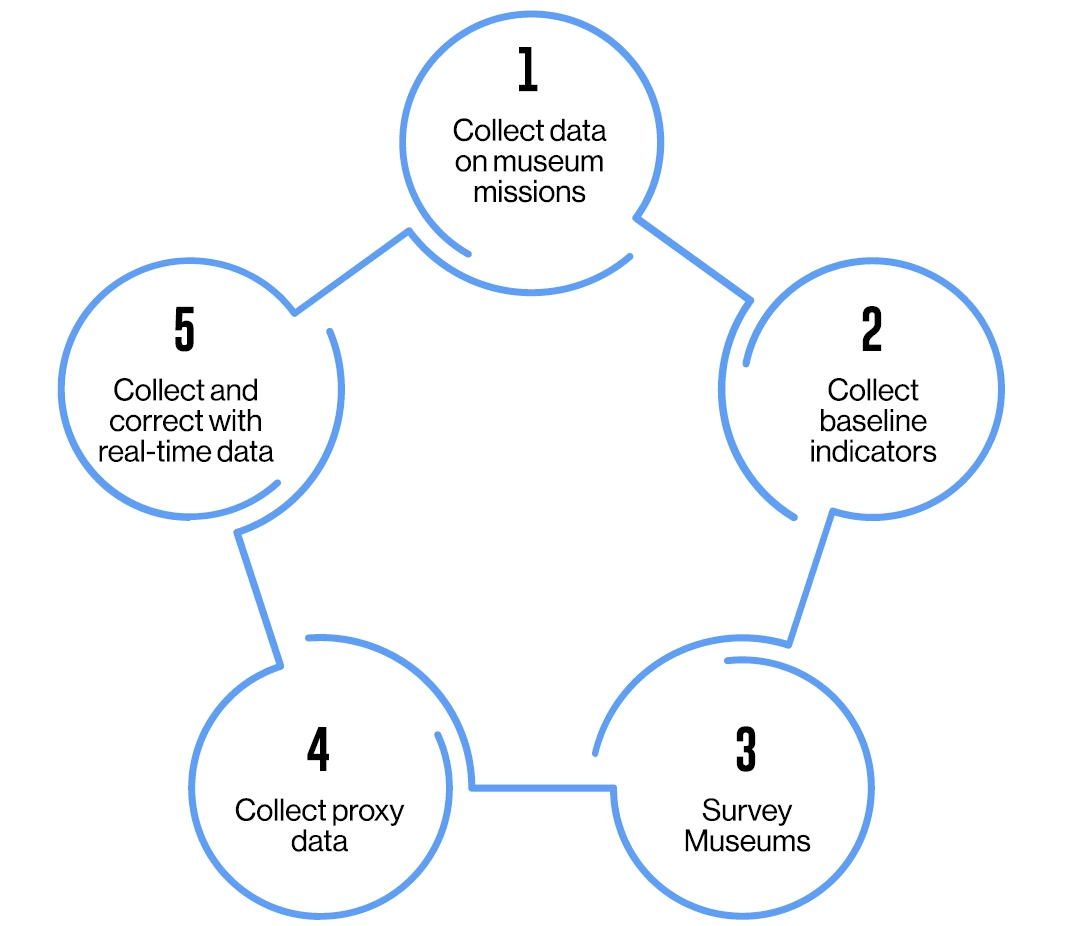
Figure 1. Logic Model for Art Museum Data Collection Process
number of hours a museum was open per week. To fill in the missing values for other data points, data from similar museums was analyzed, identifying patterns that could be used to estimate the missing figures. A degree of randomness was introduced to account for natural variations between museums. The next step focused on data points that were more closely related to a museum’s size and operations, such as exhibition space, collection size, number of employees, total expenses, advertising costs, and compensation levels. Since these data points were tied directly to how large or small a museum’s operations were, a more precise method was used. Instead of relying on random estimates, related data points were used to make informed predictions. For example, if a museum’s total expenses were missing, information such as employee numbers and staff compensation was used to estimate the missing values. As each missing datapoint was filled, that information was then used to predict other related values. For instance, once the size of a museum’s exhibition space was estimated, that figure was used to predict the size of the collection and other operational data, allowing for
progressively more accurate estimates. When it came to missing visitor numbers, the process was divided into two steps. For museums that had visitor data from previous years but were missing 2023 numbers, past visitor counts were combined with clues such as the number of Google reviews, website visits, local population size, and Instagram followers to estimate the 2023 figures. For museums with no visitor data at all, these same indicators were used to make educated guesses. Since the number of Google reviews was found to be closely correlated with visitor numbers, this was particularly useful for estimating visitation for museums lacking official data.
Who We Are
Remuseum is an independent project seeking to promote innovation among art museums across the United States. Remuseum does this work through research, convenings, and catalytic support for innovators among museum leaders (directors, educators, curators, and trustees). With a focus on relevance, governance, and financial sustainability, Remuseum supports new ways for museums to sustain and fulfill their missions, almost all of which are now centered on the public. Inspired and funded by entrepreneur and arts patron David Booth (with additional support from the Ford Foundation and the Draper Richards Kaplan Foundation), Remuseum is organized by Crystal Bridges Museum of American Art, in partnership with Art Bridges Foundation.
Initial
Findings
As non-profit organizations, museums generate no income from visitors. Rather, every museum invests money in each visitor. A museum’s budget represents a decision about how best to use its resources to achieve its public mission.
Cost Per Visitor

A starting place to understand a museum’s use of its resources to serve the public is how much it costs to support each visit. This is not to imply that a museum should seek to reduce the benefits it offers visitors, but to recognize that a museum’s ability to use its limited resources effectively to serve the maximum number of people is a relevant measure of success.
The median cost per visitor (defined simply as operating budget divided by visits) for the 153 museums in the Remuseum database is $82 (the average, skewed by a few outliers, is $101). While this number ranges from $13 to $694 for 153 museums in the database, 120 museums operate in a narrower range of $40-$150 per visitor.1
To answer a question that has already arisen, noncollecting museums (those with no permanent collections) do not appear to spend less per visitor. Eight museums out of 153 in the Remuseum database have no permanent collection, and they present an average cost per visitor of $102, right at the average for all 153 museums. Since we know that noncollecting museums avoid costs that constitute a significant proportion of the budgets of collecting museums, further research would be required to understand better how noncollecting museums (and museums with collections that are small or non-growing) spend their resources differently from collecting museums.
For purposes of this report, the Remuseum database was divided into groups based on three characteristics:
- Admission type, based on whether general admission is always free (“Free General Admission” – 48 museums out of 153) or not (“Paid General Admission” – 105 museums).
- Size of MSA, based on whether the museum’s MSA population is greater than 2.25 million (“Bigger MSA” – 90 museums) or less than 2.25 million (“Smaller MSA” – 63 museums).
- Budget size, divided between museums with total expenditures above $12 million (“Higher Budget” – 76 museums) and those with total expenditures below $12 million (“Lower Budget” – 77 museums).
Cost per Visitor
| Average Cost per Visitor | Median Cost per Visitor | |
|---|---|---|
| Overall (153 museums) | $101 | $82 |
| Free General Admission | $86 | $74 |
| Paid General Admission | $108 | $84 |
| Smaller MSA (under 2.25M) | $99 | $71 |
| Bigger MSA (over 2.25M) | $103 | $86 |
| Lower Budget (under $12M) | $73 | $62 |
| Higher Budget (over $12M) | $130 | $107 |
MSA Yield
Because every museum is located in an MSA (defined by the Office of Management and Budget to reflect the economic identity of a city or region while avoiding anomalies of individual city/county boundaries), this report measures museum visitation against the population of the MSA in which that museum is located.
The median MSA “yield” (defined simply as number of visitors divided by MSA) for 153 museums in the Remuseum database is 9% (the average, skewed by outliers, is 17%). This number ranges from below 1%
to 368% for museums in the database (two museums attract more visitors than live in their relatively small MSAs). The Remuseum database cannot identify (yet) where a given museum’s visitors come from, making this an admittedly rough estimate. In the case of museums located in areas with high tourist visitation, the MSA yield as reported in the Remuseum database will
overrepresent the number of visitors from within the region.
For this reason (and others), the MSA yield percentage is more broadly dispersed across museums than cost per visitor numbers.
Visitors as % of MSA
| Average | Median | |
|---|---|---|
| Paid/Smaller MSA/Higher Budget | 54% | 12% |
| Free/Smaller MSA/Higher Budget | 43% | 24% |
| Paid/Smaller MSA/Lower Budget | 25% | 15% |
| Free/Smaller MSA/Lower Budget | 17% | 12% |
| Free/Bigger MSA/Higher Budget | 12% | 9% |
| Paid/Bigger MSA/Higher Budget | 8% | 5% |
| Paid/Bigger MSA/Lower Budget | 3% | 2% |
| Free/Bigger MSA/Lower Budget | 1% | 1% |
New Data
Means New Questions
As with Remuseum’s first research report, this one highlights a need for additional, publicly available museum data. But even with its limits, this information offers one of the first opportunities for an exploration, by the public and by museum leaders, of how best to use museum resources to serve and engage the public. In particular, it prompts three specific conversations, around museum access, scale, and marke share, offering data that may contradict assumptions held by many in the field.
Free Admissions
A Path To Sustainability?

It is easy to determine whether any museum offers free general admission because it is a data point that is always shared with the public. That said, the difference between “free” and “paid” museums is not as clear in practice as it may sound. Many museums with free general admission charge visitors to see temporary/ traveling exhibitions. And many museums that do not offer free general admission do offer free admission to various classes of visitors – including children, students, veterans and others, or offer free admission on specific days or hours. But they do not communicate (as a “free” museum does) a simple message to everyone that the museum is open to all, and at all times, without cost.
Obviously, museums that charge for admission generate more admission revenue than museums that do not charge for admission. Like any other form of revenue-generation, the justification for charging for admission would presumably be (1) that its benefits will exceed its costs2 and/or (2) that it will support the museum’s mission in other ways, such as attracting more visitors (and thereby lowering the cost per visitor). 3
For most museums, it appears that charging for general admission may not satisfy these justifications. While one might assume that “paid” museums would either spend less on each visitor or attract more visits at the same cost per visitor (because the added revenue would provide more funds to invest in attracting visitors), neither of these results appear to be the case. Charging for admission gets the public to subsidize the museum’s costs,4 but for most museums it may do so at the cost of reducing visitation.
The Remuseum database offers no evidence that charging for admission either increases the museum’s number of visitors or lowers its cost per visitor. In fact, the data suggest that the opposite may be the case: museums with free admission may simply attract more visitors against a similar set of costs, thereby decreasing the cost of each visitor. Museums that charge for admission may simply end up spending the same amount per visitor on a smaller number of visitors.
While this finding may not be consistent with general assumptions in the field, it does correspond to an argument made by the distinguished economist Martin Feldstein in the early 1990s. Given that almost no American art museum achieves visitor levels anywhere near their physical capacity, Feldstein posited that:
Feldstein added in a footnote: “In the language of economics, it is appropriate to have no admission charge because museum attendance is a ‘public good,’ that is, the museum’s collection can be enjoyed by an additional person without increasing to total cost of production.”
No grouping of museums in the Remuseum database (large or small, or whether located in a larger or smaller MSA) reflects what conventional wisdom might suggest, which is that charging visitors would reduce the museum’s cost per visitor. While our database remains relatively small,6 it is consistent, and does not disclose any grouping of museums that spend less per visitor and charge for admission.
What might it mean that “free” museums do not appear to spend more per visitor?
Is it possible that they spend less, generating a lower cost per visitor simply because their overall costs are lower? The Remuseum database does not support such an explanation. While larger museums are more likely to charge for admission, the cost per visitor gap between free and paid museums (which is much greater for bigger museums) does not appear to result from the fact that “paid” museums simply spend more money on things that would serve and attract the public.7
Is it alternatively possible that “free” museums invest less money to attract visitors since they do not need to justify a high ticket price? Museums that spend less per visitor could also be spending less on the kinds of programming that other museums invest in to attract paying visitors. Based on the Remuseum database, that does not seem to be the case.
Free museums do not shorten their number of open hours compared to paid museums. Both groups are open, on average, 40 hours (the median number of open hours for free museums, at 41, is in fact 1 hour more than the median number of open hours for paid museums.)
Nor do free museums appear to present fewer exhibitions or invest less in programming generally. Both free and paid museums in the Remuseum database present an average of eight exhibitions each year, and as reported on IRS Form 990, both free and paid museums spend just above 70% of their total budget on program expenses.
Nor does it appear that “paid” museums spend more on advertising and marketing than “free” museums, although museums might be expected to invest more in advertising if needed to attract paying visitors. As reported on IRS Form 990, no more than 2% of museums expenses, on average, are devoted to advertising
expenses, and there is no obvious disparity between “free” and “paid” museums in their advertising expenses as a percentage of overall expenses.
While the Remuseum database allows for an analysis of several categories of expenditures (even more would be helpful), it offers little detail in terms of revenue, which is an opportunity for later phases of research.
Cost per Visitor (by Group)
| Average | Median | |
|---|---|---|
| Free/Smaller MSA/Lower Budget | $55 | $44 |
| Free/Bigger MSA/Lower Budget | $69 | $54 |
| Paid/Smaller MSA/Lower Budget | $77 | $67 |
| Paid/Bigger MSA/Lower Budget | $78 | $70 |
| Free/Bigger MSA/Higher Budget | $99 | $88 |
| Free/Smaller MSA/Higher Budget | $114 | $83 |
| Paid/Bigger MSA/Higher Budget | $128 | $108 |
| Paid/Smaller MSA/Higher Budget | $199 | $148 |
Museum researchers consistently report that museum admission fees generate, on average, only 1-4% of museum revenue (that percentage is higher for museums that attract tourist visits on a large scale)8. Museum memberships generate a bigger percentage of revenue for many museums, and the key benefit for most members is free admission, making membership revenue a surrogate for admission revenue for many museums.
Even small amounts of revenue are hard to relinquish in a tight budget (and museum budgets are always tight). And any effort to increase free admission will have to find a way to substitute lost revenue from memberships, and we need more models of how to sell memberships without selling museum access with it.9
Further research will be required to understand more than the simple proposition that for any given museum, free admission simply attracts more visitors. But that fact alone would be sufficient to suggest that museums that are built around access may also have identified a strategy to align mission with sustainability. As a museum think tank, Remuseum will devote future work to sharing case studies of museums for whom free admission has generated both greater public impact and greater revenue, while also seeking to share practical examples of ways that museums with free admission replace lost admission and membership revenue.
While practical examples of ways to fill lost sources of revenue are important, it may be that offering free admission proves to be not only an easy way to communicate a museum’s mission to potential visitors, but also an effective way to communicate a museum’s effectiveness to potential donors as well. For decades, museums have expanded their earned income lines of business – ticket prices, retail stores, restaurants and cafes, and facility rental businesses – based on the assumption that the visitor might be attracted to these offerings and therefore more willing to subsidize the cost of their visit. Calling it “earned income” means that someone thinks these operations generate more revenue than they cost. It seems possible, in contradiction to these assumptions, that the costs associated with operating those varied businesses (capital, direct, and indirect costs), which support a business model that views the visitor as a customer as much as the beneficiary of the museum’s work, may not outweigh their benefits.
Diseconomies of Scale
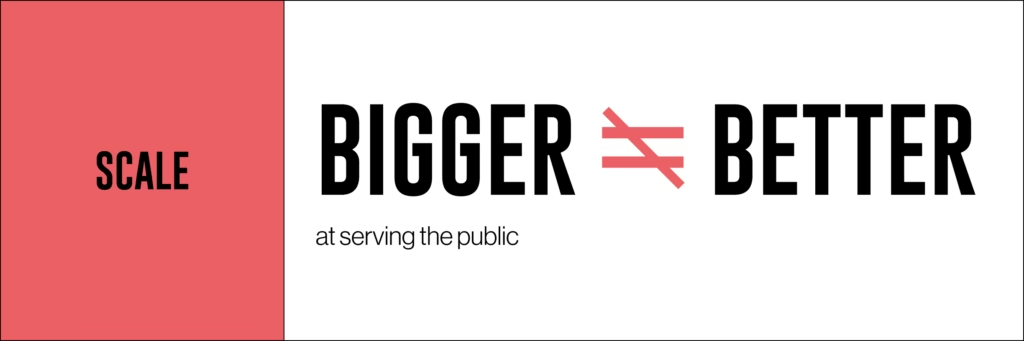
Remuseum’s research also undercuts another possible assumption regarding museum operations. Under traditional economic theory, it is assumed that production (of a consumer good or a public good) becomes more efficient as its costs are spread across a broader base. Museum budgets have consistently grown bigger over the last decades, but it is not clear that museums have gained any benefits in serving the public because of their size. Instead of any economies of scale, museums may exhibit diseconomies of scale, at least in terms of cost per visitor metrics.
Rather than spending less per visitor as they get larger, museums actually appear to spend more per visitor the larger they get.
In the groupings identified above, the biggest gap in cost per visitor is between museums with smaller budgets (below $12 million), which feature an average of $73 and a median of $62, and those with larger budgets (above $12 million), which feature an average of $130 and a median of $107.
More research is called for to understand such diseconomies of scale, including whether the scope of expenses reflecting bigger buildings and bigger collections actually impose more costs than benefits for the public. It seems possible that the investments that many museums have chosen to make are not the ones most likely to generate a return in public visitation and impact. Further research is called for to evaluate which, if any, elements of growing museum budgets are most likely generate a corresponding return in public impact.
Over the last decades, museums and museum budgets have grown well beyond the rate of inflation. If museum boards and leaders think that these increasing investments will generate a corresponding return in results and public impact, there is reason to question their assumptions, and these data call for a new conversation about how to deliver the maximum public impact with the least amount of dollars, rather than
Market Share
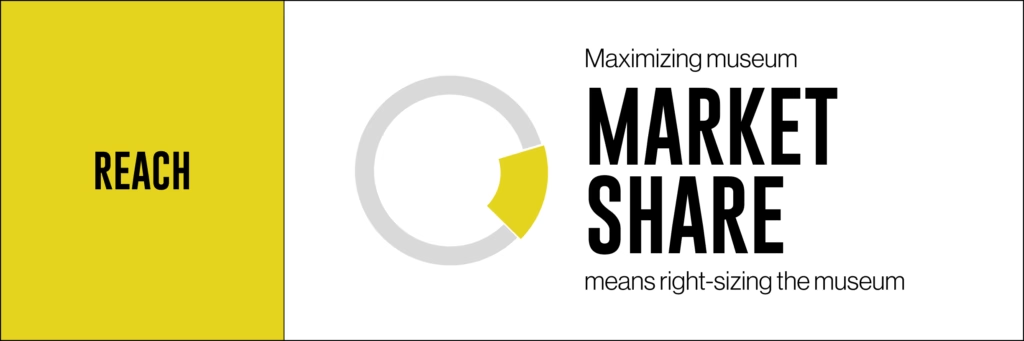
Just as a museum might use cost per visitor data to evaluate whether its current investments yield the maximum public benefit, it may also choose to evaluate its cost structure and budget based on how many people in its community visit each year. For purposes of this study, we have used MSA yield as a preliminary way to measure this impact. Since broad community visitation represents broad community support, a focus on regional yield could also help justify a case for increased private and public funding.
As for regional “yield,” museums in the Remuseum database attract a number of visitors that equates to a median of 9% of their MSAs. This number assumes that all visitors come from within the museum’s MSA, which we know is not the case.
As noted above, there is a wide range in MSA yield between museums of different scales and types.
While the Remuseum database suggests that “free” admission may confer a benefit in terms of higher MSA yield for most museums, the most interesting areas for discussion and further research result from the ways that the size of the museum and the size of the MSA itself relate to each other. The Remuseum database suggests that there may be some capacity to right-size museums to meet their potential in capturing regional visitors. In other words, the beneficial impact of free admission on MSA yield may be less important than the size of the museum and the size of the MSA where it is located (and how it combines those factors with free or paid admission).
Higher budget museums appear to generate higher MSA yields, regardless of whether they are located in a smaller or larger MSA.
It is also easier for museums to generate higher MSA yields in smaller MSAs.
These data may simply reflect aspects of scale and competition, meaning that it appears easier for larger museums to capture more market share, and easier for museums in smaller markets to attract a higher
The correlation of scale (larger budgets) with higher MSA yield appears to be magnified when the museum also offers free admission. For museums with operating budgets above $12 million, offering free admission appears to correlate with a much higher MSA yield. In smaller MSAs, for example, museums with larger operating budgets (over $12 million) and free general admission attract a number of visitors equal to nearly 25% of their MSA population, twice that of similarly situated museums without free admission.
Perhaps because there is less competition for visitors in smaller communities/regions, it appears that a larger-budget museum can highly maximize its public impact by offering free general admission.
If the museum is smaller, it is not clear that being free has a positive impact on its MSA yield. In fact, the opposite may be true: The median MSA yield for museums with budgets under $12 million is actually lower for free museums than for paid. These are the same groupings that illustrated the least difference in cost per visitor between “free” and “paid” museums.
More data are required for a full evaluation of these results, but they could suggest that smaller museums are more alike than larger museums, or that in big regions a smaller museum is both more likely to be more specialized, which allows it to both stand out and charge for admission.
Museums are increasingly looking to capture an increasing percentage of their local population as visitors. This change comes from balancing their pursuit of a national reputation with an emphasis on local impact; from recognizing that local visitors represent a more sustainable strategy compared to cyclical tourist populations; and a practical understanding that the easiest growth market for any enterprise lies in the people closest to home. Museums focused on MSA yield may learn as much from looking at right-sizing their institution based on scale and location as on whether to charge for admission. percentage of regional residents. the most.
Visitors as % of MSA (by Group)
| Average | Median | |
|---|---|---|
| Paid/Smaller MSA/Higher Budget | 54% | 12% |
| Free/Smaller MSA/Higher Budget | 43% | 24% |
| Paid/Smaller MSA/Lower Budget | 25% | 15% |
| Free/Smaller MSA/Lower Budget | 17% | 12% |
| Free/Bigger MSA/Higher Budget | 12% | 9% |
| Paid/Bigger MSA/Higher Budget | 8% | 5% |
| Paid/Bigger MSA/Lower Budget | 3% | 2% |
| Free/Bigger MSA/Lower Budget | 1% | 1% |
Assuming a museum were starting with a blank slate, able to locate itself in any city and at any scale, a decision to prioritize impact across its region would lead it to locate itself in a smaller MSA, since it would have a bigger impact on a bigger percentage of a (presumably) underserved population by doing so. (Examples of this strategy include Crystal Bridges Museum of American Art, and the Corning Museum of Glass.)
While non-profit organizations like museums rarely talk about competition (at least publicly), data on MSA yield may help frame such conversations about where and how a museum can have the biggest impact on members of the public who live nearby. For obvious reasons, that goal is a lot harder to accomplish in a large MSA, where competition is high.
Except for new institutions, museums cannot choose (or easily change) what city to be in, or whether to be large or small. But they can choose what goals to focus on and consider how they can best allocate their budget, utilize their assets, and leverage their setting, to achieve those goals. Considering how to maximize public engagement with art might lead a museum to share some of its collection with an institution in another region rather than expanding its own building (and budget). Considering how to maximize regional attendance and impact – and its case for public funding – might spur another museum to stop charging for admission.
Museums are not all the same, and neither are the cost structures they each use to serve the public good. They are located in communities with higher or lower labor costs; they have bigger or smaller collections (or no collections at all); and they benefit from endowments of very different sizes.
For that reason, Remuseum has also performed a regression analysis on the museums in its database, calculating a “conditional cost per visitor” generated after taking into account factors like market context, regional economic conditions like population wealth and education levels, a museum’s age; and whether it is a collecting institution or not. This work compares each museum’s cost per visitor with a theoretical average and can help an individual museum understand whether their actual cost per visitor is lower or higher than its statistical peers. Remuseum is sharing this information with individual museums to understand how they perceive this data and what else they might be interested in sharing to help Remuseum generate more refined research.
Remuseum is starting that process with museums that provided information to the database. As Remuseum expands and refines its database, we hope that more museums will share more data to help them and the public evaluate existing assumptions and the ways that new approaches to museum scale, budgets, and investments, may (and may not) impact the public that museums exist to serve.
Next Steps
For Remuseum: Gathering and Sharing More Data
The analysis completed so far is just the beginning. Continuing to collect data on museums will be essential for making further progress. Ongoing data collection has several benefits, such as keeping the information current and accurate, relying less on estimated values, and making it possible to track trends over time. Updating the dataset will also keep stakeholders engaged. This initial analysis focused on U.S.-based members of the AAMD and did not include university art museums due to data limitations. Future efforts will aim to expand the sample to include more art museums, including university art museums, in the data collection process. This will help provide a more comprehensive view of the broader art museum field.
While Remuseum does not have plans to publish the database in a complete, disaggregated format, Remuseum will share specific museum data by request in the hopes that interest in this one-of-a-kind database will drive an interest in transparency, benchmarking, and an openness to using data to help museums matter to more people and thrive.
For Museums
How Best To Invest in The Public?
Remuseum’s first research report posited that gaining more publicly available information about museums would help “individual museums (including their boards) better evaluate how they want to serve the public” and “may help resolve some of the ongoing debates in the field.”
Making points about access, economies of scale, and was not the purpose of this research; discovering fact-based, and possibly counterintuitive, benefits about topics like access, economies of scale, and MSA yield, was.
In other words, the report does not mean that all museums should offer free admission, but it does suggest clear benefits from focusing on a metric like cost per visitor and regional population served, and it clearly identifies next steps in this work.
Some might feel that a focus on cost per visitor would represent a victory of finance over mission, but this report indicates that the opposite is the case. Museums have often emphasized their inputs (the size of their collection and building and staffs, for example) as a way of measuring success; an emphasis on outputs (of which visitation is a foundational metric) may help museums better utilize those inputs to serve the public good. The purpose of emphasizing cost per visitor (or MSA yield) is not to minimize the benefits offered to the public (and our research has shown that museums with free admission and lower costs per visitor do not stint on their investments in art). An emphasis on effectively serving the maximum number of people ultimately focuses the museum not on its finances, but on the public.10
Since every museum spends money on every visitor, the most important question for every museum is how it wants to spend that money.11 A focus on the visitor as the purpose and beneficiary of the museum grounds most American art museums in both their own origin story, their mission, and their public value. The Remuseum database suggests that treating visitation first as a transaction rather than an investment may impair both visitation and, in the long run, the museum’s finances.
The public (and the press) pay a lot of attention to the cost of museum admission, even though – unlike the performing arts – museums, on a national basis, generate only 1-4% of their revenue from admissions.12 And during a period when an increasing percentage of museums charge for admission, attendance at American art museums has actually declined.
At a time when museum budgets are constrained by increased costs and reduced visitation, even a small amount of revenue may be hard to give up. For many museums (especially those in cities and regions with high tourist traffic), admission revenue represents a larger percentage of their budgets, and for almost all museums that charge for admission, membership revenue (which may represent more revenue than admissions itself) is a direct benefit of charging for admissions, since the primary benefit of most membership programs is free admission.
Any case for expanding free access to museums needs to help museums understand how to replace this lost revenue. As Nicholas Cullinan, Director of the British Museum, recently said, free admission “makes our museum very special [but] doesn’t mean museums shouldn’t think about how to earn income and be as selfsufficient as possible.” Is it possible that one path to self-sufficiency might come from expanding rather than limiting access, by reaching for a new level of ambition in the number of people a museum might serve, by becoming more inclusive rather than more exclusive? In fields as diverse as medical research, parks, and food justice, philanthropists offer greater support for organizations that maximize the number of people they serve. 13
What if museums invited their supporters to join them in a sustained effort that could materially increase attendance or serve a significantly higher percentage of the people who live in its region? Together with their donors, museums have acted as if growth (in buildings, collections, and budgets) was a necessary (and maybe the best) way to serve their missions. What if together they considered a shift, one that saw the public less through a transactional lens than through a philanthropic lens, one that invited both museums, funders, and the public to care equally about this work in the ways that it deserves?
Remuseum’s report is published to support art museums and their leaders and boards in constructive conversations about how these critical institutions can matter to more people and thrive.
Footnotes
1 To answer a question that has already arisen, the Remuseum database lacks sufficient evidence to state whether museums without permanent collections spend less on each visitor. Only eight out of 153 museums in the Remuseum database have no permanent collection.
2 Those benefits can take forms other than revenue. A primary reason many museums charge admission is to incentivize the purchase of museum memberships (the primary benefit of which is usually free admission).
3 An assumption underlying this argument is that museum expenses (roughly) match museum revenue. While museums can generate both surpluses and deficits, there is no reason to believe that “free” museums tolerate greater deficits than “paid” museums. If Museum A generates 20% of its budget from admission revenue and Museum B generates 0% of its budget from admission revenue (but the two otherwise match each other in other sources of revenue), one might think that Museum A might have more money to invest in visitors and therefor gain more visits.
4 The idea that the public should subsidize the cost of their visit was apparently part of the Metropolitan Museum of Art’s shift from a “pay as you wish” model to a flat admission fee for non-New Yorkers. According to museum CEO Daniel Weiss, “In addition to the financial benefit of a large pool of potential supporters…there is genuine value for all in a model of co-investment for an institution that is collectively owned and utilized.” (Weiss, Daniel. Why The Museum Matters, Yale University Press. 2022, p. 106.) This is not an argument made for many other public-serving goods and institutions, like libraries and parks.
5 Feldstein, Martin. Introduction. The Economics of Art Museums, The University of Chicago Press. 1991, p. 4.
6 The field of American art museums itself is relatively small. The membership of the AAMD, which sets policies for the entire field and admits directors of institutions with operating budgets greater than $2 million, hovers consistently around 200.
7 The median of total operating expenses for the 50 “paid” museums with operating budgets greater than $12.5 million is $25.2 million and the corresponding number for the 26 “free” museums is $26.6 million. The median of total operating costs for the 55 “paid” museums with operating budgets lower than $12.5 million is $6.8 million and the corresponding number for the 22 “free” museums is $4.4 million.
8 Grant, Daniel. “How much is too much?” The New Criterion, 23, Jul. 2019, Modern. Among other things, this percentage confirms that the stated price of admission for museums (like the stated tuition cost for private colleges) is far higher than the average admission paid. To illustrate this point, an “average” museum with a $10 million operating budget and 100,000 annual visitors might generate $250,000 in revenue from ticket sales, which is equivalent of each visitor generating only $2.50 in admission fees, far lower (by as much as a factor of 10) than the stated ticket price. Museum admission prices for paid museums are clearly set for reasons other than charging every visitor that amount.
9 Public radio stations gain members without gaining anything the general public gets, a model that may offer lessons for museums
10 It is important to recognize that, even if offering free admission did represent a sustainable financial decision for a museum, it does not on its own make the work of a museum relevant to all. Many museums have learned that offering free admission alone does not change the demographic makeup of the people who take advantage of it. As museums know, making their work relevant to the public means exhibiting art, and engaging the public in it, in a way that serves and meets the real interests and needs of the people it seeks to attract and engage. But if free admission does not answer, on its own, the question of broader relevance for museums, it is not clear that museums can answer that question without being as close to free as possible.
11 As Scott Rothkopf, the Alice Pratt Brown Director of the Whitney Museum of American Art, said recently, “In any museum, you’re choosing what to spend money on – be it storage or loans or whatever – but getting more young people in here is the most meaningful thing I can think of to subsidize.” (Crow, Kelly. “The Whitney Museum Will Be Free for All Visitors 25 Years Old and Younger” The Wall Street Journal, 22, Oct. 2024,.)
12 See Footnote #7
13 Adams, Geraldine. “Free admission ‘makes our museums special’, says BM director.” Museums Association, 17, Sept. 2024, https://www.
museumsassociation.org/museums-journal/news/2024/09/free-admission-makes-our-museums-special-says-bm-director/.